Wednesday, October 18, 2017

Washington Post: U.S. Congress engineered DEA racket to protect Big Pharma’s opioid drug giants

Although best known for publishing fake news or being forced give back a Pulitzer prize after being caught committing fake journalism, the Washington Post occasionally stumbles across an actual news story. Over the weekend, the Post published a story that reads almost exactly like Natural News a decade ago, accusing the U.S. Congress of conspiring with drug companies to hobble the DEA by erecting a protection racket for prescription opioid profits.
“In April 2016, at the height of the deadliest drug epidemic in U.S. history, Congress effectively stripped the Drug Enforcement Administration of its most potent weapon against large drug companies suspected of spilling prescription narcotics onto the nation’s streets,” says the article by Scott Higham and Lenny Bernstein. “A handful of members of Congress, allied with the nation’s major drug distributors, prevailed upon the DEA and the Justice Department to agree to a more industry-friendly law, undermining efforts to stanch the flow of pain pills…”
The WaPo story goes on:
The law was the crowning achievement of a multifaceted campaign by the drug industry to weaken aggressive DEA enforcement efforts against drug distribution companies that were supplying corrupt doctors and pharmacists who peddled narcotics to the black market. The industry worked behind the scenes with lobbyists and key members of Congress, pouring more than a million dollars into their election campaigns.
Of course, knowing that the Washington Post is capable of fabricating fake sources out of thin air — as in the paper’s fake news “Russia conspiracy” hoax narrative — we have to take all this with a grain of salt. Also keep in mind that, with this story, the Washington Post is asserting the existence of a massive drug cartel conspiracy involving Congress, drug companies and the DEA.
Ten years ago, I was ridiculed for asserting much the same thing, yet today this news blankets the pages of the Washington Post. Let’s look more closely at the structure of this drug cartel conspiracy the Post says is operating in America today, because as it turns out, WaPo actually got this story right.

Republican lawmakers are front men for Big Pharma’s illicit drug cartel

The Big Pharma opioid drug cartel protection racket was put in place by Rep. Tom Marino, a Republican, says the Post. That same story also names Republican Senator Orrin Hatch as complicit in the negotiation of the final language of the bill. Knowing the extreme dishonesty of the Washington Post’s fake journalism, there were probably all sorts of Democrats involved in this bill as well, but they didn’t bother to include them in the story, since everything the Post publishes is engineered to demonize Republicans rather than report all the relevant news facts.
“The new law makes it virtually impossible for the DEA to freeze suspicious narcotic shipments from the companies,” says the Post. “Political action committees representing the industry contributed at least $1.5 million to the 23 lawmakers who sponsored or co-sponsored four versions of the bill,” the article says, once again refusing to name any Democrats who received money from the drug industry. However, the Post does admit that President Obama signed it into law, adding that “top officials at the White House and the Justice Department have declined to discuss how the bill came to pass.”
Loretta Lynch, former attorney general and now widely known to be a treasonous cover-up artist who secretly met with Bill Clinton before shutting down any prosecution of Hillary Clinton for obstruction of justice (she deleted 33,000+ emails, remember?), “declined a recent interview request,” reports the Post.

The Washington Post runs head first into a massive government cover-up

“The DEA and Justice Department have denied or delayed more than a dozen requests filed by The Post and ’60 Minutes’ under the Freedom of Information Act for public records that might shed additional light on the matter,” says the Post.
When the Washington Post attempted to interview Rep. Tom Marino, his staff called the Capitol Police as a warning to reporters. Blocked at every turn, the Post says it is now suing the DOJ for documents that should have been released under the Freedom of Information Act (FOIA).
In other words, the Washington Post, a pro big-government paper that almost universally believes government can do no wrong, is suddenly finding out just how corrupt, incompetent and dangerous a government racket can truly become. When big pharma’s billions of dollars get funneled into the pockets of greedy Washington lawmakers, the health of the entire nation is put at risk while powerful corporations are granted a kind of “legal immunity” while dealing dangerous drugs.
As the Post reports:
Today, Rannazzisi is a consultant for a team of lawyers suing the opioid industry. Separately, 41 state attorneys general have banded together to investigate the industry. Hundreds of counties, cities and towns also are suing. “This is an industry that’s out of control. If they don’t follow the law in drug supply, and diversion occurs, people die. That’s just it, people die,” he said.
A key reason for the cover-up, of course, is that government officials routinely take jobs with the very same drug companies they previously regulated. Via the Post:
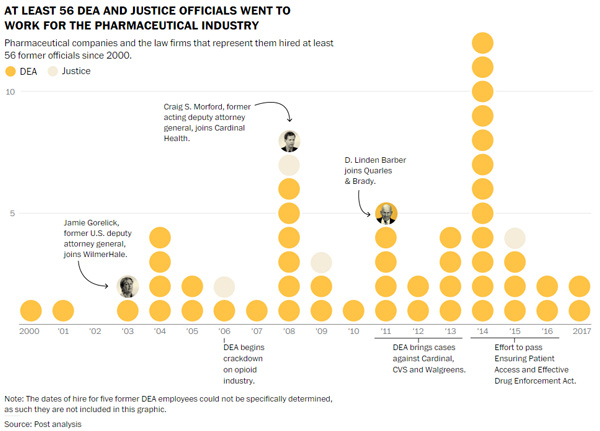
In 2011, Linden Barber left the DEA to join the Washington, D.C., office of the law firm Quarles & Brady. He started a practice representing drug companies. “If you have a DEA compliance issue or you’re facing a government investigation,” he said in a promotional video for the firm, “I’d be happy to hear from you.”
Barber’s move turned out to be a key moment in the struggle between drug companies and the government, but it was far from the only one. Dozens of top officials from the DEA and Justice Department have stepped through Washington’s revolving door to work for drug companies.
The DEA, in other words, quickly became nothing more than an extension of the Big Pharma drug cartel. This is known as a regulatory “captive” structure, where regulatory agencies such as the FDA, EPA, USDA and DEA very quickly become “captured” by the very industry they once claimed the regulate. As Natural News readers know very well, nearly every federal regulatory body has already been overrun by powerful industry interests.
The EPA, for example, is one of the top polluters in America, routinely “legalizing” toxic pesticides and herbicides that poison consumers and the environment. The USDA is a front group for the GMO biotech industry, and the FDA is nothing but a fake science cover for the corrupt, criminally-run pharmaceutical industry. The CDC, similarly, is a fake science front for the vaccine industry.
As far as the DEA goes, the independent media has been publishing stories for years that document how the DEA is running the drugs in America. It’s the DEA that grants certain drug cartels immunity from prosecution, of course, while taking down competing organizations in an effort to build near-monopoly drug cartels. Asset seizure laws also allowed the DEA to profit from taking down drug-running cells that were previously allowed to grow and prosper in order to build up assets that eventually became worth seizing. In effect, the DEA has been running a “drug cartel farming operation” in America.
Now, thanks to the Washington Post’s investigation, we learn that the DEA directly negotiated with the drug industry to grant opioid manufacturers selective immunity from criminal seizure and prosecution. Is anyone really surprised? This has been the DEA’s business model for decades.
The following graphic, published by the Washington Post, reveals that at least 56 DEA and Justice Dept. officials left their government jobs to work for the pharmaceutical industry:

In other words, America has become a narco-pharma state, and the infiltration of government by powerful, drug-dealing corporations is now complete. The drug pushers are running Congress and the regulators. They’re also running nearly the entire mainstream media, which is why independent media organizations like Natural News were a full decade ahead of the Washington Post in sounding the alarm on this sort of collusion. (What the mainstream media is just now waking up to, Natural News already reported in 2007 or earlier.)

Congress keeps medical marijuana criminalized to protect the profits of the corrupt opioid drug industry

Once you fully grasp the depth of collusion between the opioid drug cartels, Congress and the DEA, it’s not difficult to figure out why they’ve all conspired to keep medical marijuana, CBD and hemp extracts illegal at the federal level. The protection racket requires anything that competes with prescription opioids to be criminalized.
It’s all about limiting consumers’ options and funneling them into a life of personal addiction and Big Pharma profits. As long as the money keeps rolling in, federal workers will keep taking jobs with the drug industry, exploiting their contacts and influence in Washington to keep their toxic, deadly drugs flowing into the hands of vulnerable Americans. At the same time, every effort will be undertaken to keep medical marijuana illegal, thereby denying citizens and veterans an affordable, safe and highly effective option for pain control.
It has taken until 2017 for the mainstream media to finally admit all this is happening. The deep state collusion and conspiracy is now finally being covered by the Washington Post and 60 Minutes. Just remember that Natural News warned America about all this a decade ago and was ridiculed for believing in “conspiracy theories.”
Suddenly, it seems, the narco-pharma-government industrial complex is no longer a “theory.” It’s a business model for corporate America.

Read more: https://www.naturalnews.com/2017-10-16-washington-post-u-s-congress-engineered-dea-racket-to-protect-big-pharmas-opioid-drug-giants.html

Monday, October 2, 2017

Five things that just don’t add up about the Las Vegas mass shooting

Our hearts and prayers go out to all those killed or injured in the Las Vegas shooting, and in a nation where so many anti-Americans are kneeling in pampered protest, this mass shooting saw veterans and police officers standing up, helping the victims and heading straight for the shooter to take him out. Real Americans don’t kneel, they stand and get to work to save lives. Today I offer tremendous gratitude to all the first responders who helped save lives and stop the violence.
Although the news reporting on this shooting is still in its early stages, there are five strange things that just don’t add up about this massacre (so far). I run through them below.

#1) Dozens of concert-goers reported the presence of multiple shooters

Although law enforcement says there was only one shooter, multiple witnesses are openly reporting the presence of multiple shooters. This could reasonably be the result of confusion and chaos, but it’s also highly suspicious that the shooter had “full auto” weapon which is usually limited to law enforcement or military personnel.
This question about multiple shooters was also raised after the Aurora, Colorado “Batman movie theater” shooting, in which numerous witnesses reported the presence of multiple shooters.
If this shooting was carried out by multiple shooters, it would obviously indicate planning and coordination among a group of people who sought to carry out the shooting for a political purpose of some kind.

#2) Who warned concert-goers they were “all going to die” a full 45 minutes before the shooting started?

Via the UK Express:
One woman, who was at the Route 91 music event, claimed an unidentified woman had told other concert-goers they were “all going to die” after pushing her way to the front of the venue.
The witness, 21, told local news: “She had been messing with a lady in front of her and telling her she was going to die, that we were all going to die.
“They escorted her out to make her stop messing around with all the other people, but none of us knew it was going to be serious.”
She described the lady as Hispanic. The lady was escorted from the venue along with a man.
The unnamed witness, who was attending the event on her 21st birthday, described the pair as short, both around 5 ft 5ins to 5ft 6ins tall, and looked like “everyday people”.
It’s clear that neither of these two people were the shooter, as the shooter is a much taller Caucasian man. Thus, this is not a “lone gunman” massacre. There was coordination. At least three people were aware this shooting was about to take place.

#3) The weapon you hear on videos was FULL AUTO, which is almost impossible to acquire through legal means

The multitude of videos that captured the event clearly indicate that at least one shooter was running a full auto weapons system. Such weapons are almost impossible for “civilians” to acquire. Although some pre-1986 full auto weapons are available for sale, they require extensive ATF documentation, background checks and extremely long wait periods approaching one year. Plus, they tend to cost $25,000 or more, and they’re extremely rare.
Full auto weapons, however, are widely owned by police officers, federal officials and military organizations. It will be very interesting to find out where this weapon came from and how it was acquired.

#4) Why were the exits blocked, trapping victims like rats in a maze?

Numerous reports from witnesses who were on the scene reveal that nearly all the exits were blocked. One witness described the situation as “being caught like a rat in a maze” with numerous “dead ends.”
Why were nearly all the exits blocked? In essence, the concert created a kill zone that amplified the casualties. So far, according to the Clark County Sheriff in Vegas, 515 people have been injured and 59 people have so far died. These are unthinkable numbers, approaching war-time casualty counts. It’s clear from the coverage that this shockingly high body count would not have been possible if people had been free to flee the concert venue.
In essence, the concert trapped the people, preventing them from escaping, and denying them the ability to seek cover. From there, sustained, full-auto gunfire is almost impossible to survive.
In addition, once the shooting started, the stage lights were turned to the crowd, lighting up the crowd and making them an easier target for the shooter(s). Was this deliberate?

#5) Why did the shooter have as many as 10 firearms in his room?

According to news reports, the shooter — identified as Stephen Paddock — had as many as 10 firearms in his room, including several rifles. If he was the only shooter, what’s the point of having so many rifles? One man can obviously only shoot one rifle, and since he had a full auto rifle, he could obviously achieve his evil aims by focusing on his one rifle. There was no need for him to have multiple rifles.
So were the other rifles brought to the room to “stage” the crime scene with an abundance of guns? Why would one elderly man bother to carry 8 – 10 weapons to a hotel room in the first place? That’s a lot of work. Rifles aren’t lightweight devices.
I find the idea that a lone, elderly man would carry so many rifles to a hotel room for no practical reason to be highly suspicious. It makes no sense at all.

Read more: https://www.naturalnews.com/2017-10-02-five-things-that-just-dont-add-up-about-the-las-vegas-mass-shooting.html

Friday, September 22, 2017

Fluoride Exposure in Utero Linked to Lower IQ in Children in NIEHS-funded study

The results of the first ever US government funded study of fluoride/IQ have now been published. A team of researchers funded by the National Institutes of Health found that low levels of fluoride exposure during pregnancy are linked to significantly reduced IQ in children, according to a study published on September 19, 2017 in the journal Environmental Health Perspectives.
The study, entitled Prenatal Fluoride Exposure and Cognitive Outcomes in Children at 4 and 6–12 Years of Age in Mexico, was conducted by a team of scientists from University of Toronto, University of Michigan, Harvard, and McGill, and found:
“…higher levels of maternal urinary fluoride during pregnancy (a proxy for prenatal fluoride exposure) that are in the range of levels of exposure in other general population samples of pregnant women as well as nonpregnant adults were associated with lower scores on tests of cognitive function in the offspring at 4 and 6–12 y old.”
Within hours of it being published, FAN released a video response featuring Chemist and Toxicologist, Professor Paul Connett, PhD.

TAKE ACTION NOW:

  1. Share FAN’s Facebook and Twitter posts on social media.
  2. Share FAN’s webpage on the study with friends, family, co-workers;     particularly expecting mothers.
  3. Share the study, the accompanying press release, FAN’s Video, and the Newsweek article with your city councilors and Water Board, urging them to protect the next generation by opposing fluoridation.
More to come…

FAN Comment

The study found a very large and significant effect. An increase in urine fluoride of 1 mg/L was associated with a drop in IQ of 5 to 6 points. Such a drop of IQ in the whole population would half the number of very bright children (IQ greater than 130) and double the number of mentally handicapped (IQ less than 70).
Most of the Mexican women had urine fluoride between 0.5 and 1.5 mg/L. Studies have found that adults in the USA have between about 0.6 and 1.5 mg/L, almost exactly the same range. From the low end of that range to the high end is a difference of 1 mg/L which is what caused the 5 to 6 IQ point difference in the children of the study mothers.
This new study had fluoride exposures almost the same as what is found in fluoridating countries like the USA. The paper shows the relationship between urine fluoride and IQ in the graph (Figure 2) reproduced here:

The data in this graph has been adjusted for numerous potential confounding factors like sex, birth weight, gestational age, and whether the mother smoked. Other potential confounders had already been ruled out, including lead, mercury, alcohol consumption during pregnancy, mother’s education, mother’s IQ, and quality of home environment.
FAN has redrawn this graph in simplified form to better illustrate the relationship found between mothers’ urine fluoride and childrens’ IQ.
This simplified version of the graph highlights the range of urine fluoride levels common in women in the USA with the blue text and bracket. When comparing mothers at the low end to those at the high end of this range, the subsequent loss of IQ in their children was 6 points. The light red shaded zone around the relationship line is the 95% Confidence Interval and demonstrates that the relationship is statistically significant across the entire range of fluoride exposures.
Important Points:
1.  The loss of IQ is very large.  The child of a mother who was drinking 1 ppm F water would be predicted to have 5 to 6 IQ points lower than if the mother had drunk water with close to zero F in it.
2.  The study measured urine F, which is usually a better indicator of total F intake than is the concentration of F in drinking water.  When drinking water is the dominant source of F,, urine F and water F are usually about the same.  So, the average urine F level in this study of 0.9 mg/L implies that woman was ingesting the same amount of F as a woman drinking water with 0.9 mg/L F.
3.  The range of F exposures in this study is likely to be very close to the range in a fluoridated area of the United States.  The doses in this study are directly applicable to areas with artificial fluoridation.  There is no need to extrapolate downward from effects at higher doses.  The claims by fluoridation defenders that only studies using much higher doses than occur in areas with artificial fluoridation have shown a loss of IQ are squarely refuted by this study.  Those false claims range from 11 times to 30 times higher, but are based on the logical fallacy that it is the highest dose amongst several studies that is relevant, when it is the LOWEST dose amongst studies that is most relevant.
4.  This study was very carefully done, by a group of researchers who have produced over 50 papers on the cognitive health of children in relationship to environmental exposures.  This was funded by the NIH and was a multi-million dollar study.  This was the group’s first study of fluoride, their other studies mostly dealing with lead, mercury, and other environmental neurotoxicants.
5.  This study controlled for a wide range of potential factors that might have skewed the results and produced a false effect.  It was able to largely rule out confounding by these other factors.  The factors ruled out included Pb, Hg, socio-economic status, smoking, alcohol use, and health problems during pregnancy.
6.  This study offers confirmation of previous less sophisticated studies in Mexico, China and elsewhere.  Some of those studies had higher F exposures than are commonly found in the USA, but many did not.  The sole study in a country with artificial water fluoridation (as opposed to artificial salt fluoridation which was likely a main source of F in this new study) was by Broadbent in New Zealand.  That found no association between water F and IQ and was trumpted by fluoridation defenders.  But that study was shown to have almost no difference in TOTAL F intake between the children with fluoridated water and those with unfluoridated water, since most of the unfluoridated water children were given F supplements.
7.  The study authors are cautious in their conclusions, as is common for scientists.  But the implications of this study are enormous.  A single study will never prove that F lowers IQ at doses found in fluoridated areas, but this is more than a red flag.  It is a cannon shot across the bow of the 80 year old practice of artificial fluoridation.


Read more:http://fluoridealert.org/content/bulletin_9-21-17/

Thursday, September 21, 2017

Massive corruption and criminal misconduct uncovered at the CDC

Activist Robert F. Kennedy Jr., whose work to expose the connection between mercury-laced vaccines and increased autism rates has earned him wide praise and plaudits, has released a new report which describes a number of criminal acts allegedly committed by employees and consultants working for the Centers for Disease Control and Prevention.
The report, produced in conjunction with the World Mercury Project [PDF], is said to contain new evidence of “corruption and scientific misconduct” at the CDC, and that employees and consultants for the government health agency engaged in “questionable ethics and scientific fraud” that has “resulted in untrustworthy vaccine safety science,” a press release noted.
The report’s authors single out Dr. Poul Thorsen, a Danish scientist who has been indicted by U.S. authorities for allegedly stealing millions from the CDC and tainting research to hide the dangers posed by vaccines. Indicted in 2011, Thorsen remains on the loose.
As Natural News reported in August 2014:
Thorsen, as you may recall, was heavily involved in producing a stream of fraudulent studies that supposedly “disproved” the now-evident link between vaccines and autism. The CDC has also continually cited Thorsen’s studies as “evidence” that vaccines are safe, declaring the debate to be over in light of their findings.
In addition to uncovering other information, Kennedy and officials at the World Mercury Project say they have found evidence that Thorsen and his collaborators did not get permission from an Institutional Review Board (IRB) to carry out their research, published in the New England Journal of Medicine in 2002 and the journal Pediatrics the following year.
“In 2011, the Department of Justice indicted Thorsen on 22 counts of wire fraud and money laundering for stealing over $1 million in CDC grant money earmarked for autism research,” the statement notes. “The product of Thorsen’s work for CDC was a series of fraud-tainted articles on Danish autism rates that, today, form the backbone of the popular orthodoxy that vaccines don’t cause autism.”
After discovering in 2009 that Thorsen never applied for or received IRB approvals, CDC staff failed to report it or subsequently retract the illegitimate studies. Instead, as documents obtained via Freedom of Information Act requests show, CDC supervisors merely ignored the misconduct, essentially covering it up.
As such, today vaccine makers “can put anything they want in that vaccine and they have no accountability for it,” Kennedy told California parents during a screening of the film “Trace Amounts” in 2015. “This is a holocaust, what this is doing to our country.” (Related: Vaccination now scientifically linked to learning disabilities in children; vaccinated children show 520% increased risk compared to non-vaccinated.)
Regarding Thorsen’s alleged misconduct, the report says it undermines the legitimacy of his studies, which were relied upon in large part to refute vaccine injury claims filed with the National Vaccine Injury Compensation Program (NVICP), which is run by the U.S. Department of Health and Human Services.
In addition, the report says, Thorsen’s ‘findings’ were used in the NVICP’s “Omnibus Proceeding” in which the agency dismissed 5,000 claims by families who said their children developed autism following vaccinations. “These claims, if settled in the claimant’s favor,” the statement says, “would have resulted in payouts totaling an estimated $10 billion.”
In a statement of his own regarding the new information and report, Kennedy, who is chairman of the World Mercury Project, said his organization “calls upon Attorney General Jeff Sessions to extradite Thorsen back to the U.S. to face prosecution. We also call upon Secretary of Health and Human Services Dr. Tom Price to retract the Thorsen-affiliated autism research papers that are the fruit of illegally conducted research.”
The scientific community has long known that mercury in all its forms — including mercury-laced thimerosal, a preservative that is still found in some vaccines — is a neurotoxin and can hinder neurological development.
J.D. Heyes is a senior writer for NaturalNews.com and NewsTarget.com, as well as editor of The National Sentinel.
Sources include:
WorldMercuryProject.org
NaturalNews.com

Read more: https://www.naturalnews.com/2017-09-19-massive-corruption-and-criminal-misconduct-uncovered-at-the-cdc-world-mercury-project-issues-call.html

Wednesday, September 20, 2017

Climate change science implodes as IPCC climate models found to be “totally wrong”

A stunning new science paper authored by climate change alarmists and published in the science journal Nature Geoscience has just broken the back of the climate change hoax. The paper, authored by Myles R. Allen, Richard J. Millar and others, reveals that global warming climate models are flat wrong, having been deceptively biased toward “worst case” warming predictions that now turn out to be paranoid scare mongering.
The paper, entitled, “Emission budgets and pathways consistent with limiting warming to 1.5 °C,” concludes that the global warming long feared and hyped by everyone from Al Gore to CNN talking heads was based on faulty software models that don’t stand up to actual measured temperatures in the real world. In technical jargon, the paper explains, “We show that limiting cumulative post-2015 CO2 emissions to about 200GtC would limit post-2015 warming to less than 0.6°C in 66% of Earth system model members.”
In effect, the current global warming software models used by the IPCC and cited by the media wildly over-estimate the warming effects of CO2 emissions. How much do they over-estimate warming? By about 50%. Where the software models predicted a 1.3 C rise in average global temperatures, only a rise of about 0.9 C has actually been recorded (and many data points in that average have, of course, been fabricated by climate change scientists to push a political narrative). In other words, carbon dioxide emissions don’t produce the warming effects that have been blindly claimed by climate change alarmists.
“Climate change poses less of an immediate threat to the planet than previously thought because scientists got their modelling wrong,” reports the UK Telegraph. “New research by British scientists reveals the world is being polluted and warming up less quickly than 10-year-old forecasts predicted, giving countries more time to get a grip on their carbon output.”
In other words, the climate change threat has been wildly overstated. The fear mongering of Al Gore and the government-funded science community can truly only be described as a “junk science hoax.”

Climate alarmists suddenly find themselves admitting they were wrong all along

“The paper … concedes that it is now almost impossible that the doomsday predictions made in the last IPCC Assessment Report of 1.5 degrees C warming above pre-industrial levels by 2022 will come true,” writes James Delingpole. He goes on to say:
One researcher – from the alarmist side of the argument, not the skeptical one – has described the paper’s conclusion as “breathtaking” in its implications.
He’s right. The scientists who’ve written this paper aren’t climate skeptics. They’re longstanding warmists, implacable foes of climate skeptics, and they’re also actually the people responsible for producing the IPCC’s carbon budget.
In other words, this represents the most massive climbdown from the alarmist camp.
Are we about to see climate change alarmists owning up to the fact that real-world data show their software models to be rooted in junk science? The unraveling has begun, but there is so much political capital already invested in the false climate change narrative that it will take years to fully expose the depth of scientific fraud and political dishonesty underpinning the global warming hoax.

Climate change software models were deliberately tweaked to paint an exaggerated doomsday picture in order to scare the world into compliance panic

What’s clear from all this is that IPCC software models were deliberately biased in favor of the worst-case “doomsday” predictions in order to terrorize the world with a fake climate change hoax. But now the fake science is catching up to them, and they’re getting caught in their own lies.
The software models, by the way, were fraudulently programmed with dishonest model “weights” to produce alarming warming predictions no matter what temperature data points were entered into the system.
This is best explained in this Natural News article which goes into great detail, covering the IPCC global warming software modeling hoax:

Hacking the IPCC global warming data

The same left-wing media outlets that fabricated the “Russian hacking” conspiracy, curiously, have remained totally silent about a real, legitimate hacking that took place almost two decades earlier. The IPCC “global warming” software models, we now know, were “hacked” from the very beginning, programmed to falsely produce “hockey stick” visuals from almost any data set… include “random noise” data.
What follows are selected paragraphs from a fascinating book that investigated this vast political and scientific fraud: The Real Global Warming Disaster by Christopher Booker(Continuum, 2009). This book is also available as an audio book from Audible.com, so if you enjoy audio books, download a copy there.
Here’s what Booker found when he investigated the “hacking” of the temperature data computer models:
From “The Real Global Warming Disaster” by Christopher Booker: (bold emphasis added)
Nothing alerted us more to the curious nature of the global warming scare than the peculiar tactics used by the IPCC to promote its orthodoxy, brooking no dissent. More than once in its series of mammoth reports, the IPCC had been caught out in very serious attempts to rewrite the scientific evidence. The most notorious instance of this was the extraordinary prominence it gave in 2001 to the so-called ‘hockey stick’ graph, mysteriously produced by a relatively unknown young US scientist, which completely redrew the accepted historical record by purporting to show temperatures in the late twentieth century having shot upwards to a level far higher than had ever been known before. Although the ‘hockey stick’ was instantly made the central icon of the IPCC’s cause, it was within a few years to become one of the most comprehensively discredited artefacts in the history of science.
Similarly called into serious doubt was the reliability of some of the other temperature figures on which the IPCC based its case. Most notably these included those provided by NASA’s Goddard Institute for Space Studies (GISS), run by Dr James Hansen, A1 Gore’s closest scientific ally, which were one of the four official sources of temperature data on which the IPCC relied. These were shown to have been repeatedly ‘adjusted’, to suggest that temperatures had risen further and more steeply than was indicated by any of the other three main data-sources.
…Out of the blue in 1998 Britain’s leading science journal Nature, long supportive of the warming orthodoxy, published a new paper on global temperature changes over the previous 600 years, back to 1400. Its chief author was Michael Mann, a young physicist-turned-climate scientist at the University of Massachusetts, who had only completed his PhD two years before. In 1999 he and his colleagues published a further paper, based only on North America but extending their original findings over 1000 years.
Their computer model had enabled them to produce a new temperature graph quite unlike anything seen before. Instead of the previously familiar rises and falls, this showed the trend of average temperatures having gently declined through nine centuries, but then suddenly shooting up in the twentieth century to a level that was quite unprecedented.
In Mann’s graph such familiar features as the Mediaeval Warm Period and the Little Ice Age had simply vanished. All those awkward anomalies were shown as having been illusory. The only real anomaly which emerged from their studies was that sudden exponential rise appearing in the twentieth century, culminating in the ‘warmest year of the millennium’, 1998.
As would eventually emerge, there were several very odd features about Mann’s new graph, soon to be known as the ‘hockey stick’ because its shape, a long flattish line curving up sharply at the end, was reminiscent of the stick used in ice hockey. But initially none might have seemed odder than the speed with which this obscure study by a comparatively unknown young scientist came to be taken up as the new ‘orthodoxy’.
So radically did the ‘hockey stick’ rewrite all the accepted versions of climate history that initially it carried all before it, leaving knowledgeable experts stunned. It was not yet clear quite how Mann had arrived at his remarkable conclusions, precisely what data he had used or what methods the IPCC had used to verify his findings. The sensational new graph which the IPCC made the centrepiece of its report had been sprung on the world out of left field.
…Yet when, over the years that followed, a number of experts from different fields began to subject Mann’s two papers to careful analysis, some rather serious questions came to be asked about the basis for his study.
For a start, although Mann and his colleagues had cited other evidence for their computer modelling of historical temperatures, it became apparent that they had leaned particularly heavily on ‘proxy data’ provided by a study five years earlier of tree-rings in ancient bristlecone pine trees growing on the slopes of California’s Sierra Nevada mountains. ‘Proxies’ used to calculate temperature consist of data other than direct measurement, such as tree rings, stalactites, ice cores or lake sediments.
According to the 1993 paper used by Mann, these bristlecone pines had shown significantly accelerated growth in the years after 1900. But the purpose of this original study had not been to research into past temperatures. As was made clear by its title – ‘Detecting the aerial fertilisation effect of atmospheric C02 enrichment in tree-ring chronologies’ – it had been to measure the effect on the trees’ growth rate of the twentieth-century increase in C02 levels.
Tree rings are a notoriously unreliable reflector of temperature changes, because they are chiefly formed during only one short period of the year, and cannot therefore give a full picture. This 1993 study of one group of trees in one untypical corner of the US seemed a remarkably flimsy basis on which to base an estimate of global temperatures going back 1000 years.
Then it transpired that, in order to show the twentieth-century section of the graph, the terrifying upward flick of temperatures at the end of the ‘hockey stick’, spliced in with the tree-ring data had been a set of twentieth-century temperature readings, as recorded by more than 2,000 weather stations across the earth’s surface. It was these which more than anything helped to confirm the most dramatic conclusion of the study, that temperatures in the closing decades of the twentieth century had been shooting up to levels unprecedented in the history of the last 1,000 years, culminating in the ‘warmest year of the millennium’, 1998.
Not only was it far from clear that, for this all-important part of the graph, two quite different sets of data had been used. Also accepted without qualification was the accuracy of these twentieth-century surface temperature readings. But the picture given by these was already being questioned by many expert scientists who pointed to evidence that readings from surface weather stations could become seriously distorted by what was known as the ‘urban heat island effect’. The majority of the thermometers in such stations were in the proximity of large and increasingly built-up population centres. It was well-established that these heated up the atmosphere around them to a significantly higher level than in more isolated locations.
Nowhere was this better illustrated than by contrasting the temperature readings taken on the earth’s surface with those which, since 1979, had been taken by NASA satellites and weather balloons, using a method developed by Dr Roy Spencer, responsible for climate studies at NASA’s Marshall Space Centre, and Dr John Christie of the University of Alabama, Huntsville.
Surprisingly, these atmospheric measurements showed that, far from warming in the last two decades of the twentieth century, global temperatures had in fact slightly cooled. As Spencer was at pains to point out, these avoided the distortions created in surface readings by the urban heat island effect. The reluctance of the IPCC to take proper account of this, he observed, confirmed the suspicion of ‘many scientists involved in the process’ that the IPCC’s stance on global warming was ‘guided more by policymakers and politicians than by scientists’.
What was also remarkable about the ‘hockey stick’, as was again widely observed, was how it contradicted all that mass of evidence which supported the generally accepted picture of temperature fluctuations in past centuries. As was pointed out, tree-rings are not the most reliable guide to assessing past temperatures. Scores of more direct sources of proxy evidence had been studied over the years, from Africa, South America, Australia, Pakistan, Antarctica, every continent and ocean of the world.
Whether evidence was taken from lake sediments or ice cores, glaciers in the Andes or boreholes in every continent (Huang et ai, 1997), the results had been remarkably consistent in confirming that the familiar view was right. There had been a Little Ice Age, across the world. There had similarly been a Mediaeval Warm Period. Furthermore, a mass of data confirmed that the world had been even warmer in the Middle Ages than it was in 1998.
The first comprehensive study to review this point was published in January 2003 by Dr Willie Soon and his colleague Dr Sallie Baliunas of the Harvard-Smithsonian Center for Astrophysics. They had examined 140 expert studies of the climate history of the past 1,000 years, based on every kind of data. Some had given their findings only in a local or regional context, others had attempted to give a worldwide picture. But between them these studies had covered every continent. The question the two researchers had asked of every study was whether or not it showed a ‘discernible climate anomaly’ at the time of (1) the Little Ice Age and (2) the Mediaeval Warm Period; and (3) whether it had shown the twentieth century to be the warmest time in the Millennium.
Their conclusion was unequivocal. Only two of the studies they looked at had not found evidence for the Little Ice Age. Only seven of the 140 studies had denied the existence of a Mediaeval Warm Period, while 116 had confirmed it.
On the crucial question of whether or not the twentieth century had been the warmest of the past thousand years, only 15 studies, including that of Mann himself, had unambiguously agreed that it was. The vast majority accepted that earlier centuries had been warmer. The conclusion of Soon and Baliunas was that ‘Across the world, many records reveal that the twentieth century is probably not the warmest nor a uniquely extreme climatic period of the last millennium.’
But if Mann and his colleagues had got the picture as wrong as this survey of the literature suggested, nothing did more to expose just how this might have come about than a remarkable feat of analysis carried out later in the same year by two Canadians and published in October 2003. (S. McIntyre and R. McKitrick, 2003, ‘Corrections to the Mann et al. (1998) proxy databse and northern hemispheric average temperature series’, Energy and Environment, 14, 752-771. In the analysis of McIntyre and McKitrick’s work which follows, reference will also be made to their later paper, McIntyre and McKitrick, 2005b, ‘The M & M critique of the MBH98 Northern Hemisphere climate index, Update and applications’, Energy and Environment, 16, 69-99, and also to McKitrick (2005), ‘What is the “Hockey Stick” debate about?’, op. cit.)
Stephen McIntyre, who began their study, was a financial consultant and statistical analyst specialising in the minerals industry, and was later joined by Ross McKitrick, a professor of economics at Guelph University. Neither made any pretensions to being a climate scientist, but where they did have considerable expertise was in knowing how computers could be used to play around with statistics. They were also wearily familiar with people using hockey sticklike curves, showing an exaggerated upward rise at the end, to sell a business prospect or to ‘prove’ some tendentious point.
Intrigued by the shape of the IPCC’s now famous ‘hockey stick’ graph, in the spring of 2003 McIntyre approached Mann and his colleagues to ask for a look at their original data set. ‘After some delay’, Mann ‘arranged provision of a file which was represented as the one used’ for his paper. But it turned out not to include ‘most of the computer code used to produce their results’. This suggested to McIntyre, who was joined later that summer by McKitrick, that no one else had previously asked to examine it, as should have been required both by peer-reviewers for the paper published in Nature and, above all, by the IPCC itself. (This account of the ‘hockey stick’ saga is based on several sources, in particular Ross McKitrick’s paper already cited , ‘What is the “hockey stick” debate about?’ (2005), and his evidence to the House of Lords Committee on Economic Affairs, ‘The Economics of Climate Change’, Vol. II, Evidence, 2005. See also David Holland, ‘Bias and concealment in the IPCC Process: the “Hockey Stick” affair and its implications’ (2007), op. cit.)
When McIntyre fed the data into his own computer, he found that it did not produce the claimed results. At the heart of the problem was what is known as ‘principal component analysis’, a technique used by computer analysts to handle a large mass of data by averaging out its components, weighting them by their relative significance.
One of the first things McIntyre had discovered was that the ‘principal component analysis’ used by Mann could not be replicated. ‘In the process of looking up all the data sources and rebuilding Mann’s data set from scratch’, he discovered ‘quite a few errors concerning location labels, use of obsolete editions, unexplained truncations of various series etc.’ (for instance, data reported to be from Boston, Mass., turned out to be from Paris, France, Central England temperature data had been truncated to leave out its coldest period, and so forth).
But the real problem lay with the ‘principal component analysis’ itself. It turned out that an algorithm had been programmed into Mann’s computer model which ‘mined’ for hockey stick shapes whatever data was fed into it. As McKitrick was later to explain, ‘had the IPCC actually done the kind of rigorous review that they boast of they would have discovered that there was an error in a routine calculation step (principal component analysis) that falsely identified a hockey stick shape as the dominant pattern in the data. The flawed computer program can even pull out spurious hockey stick shapes from lists of trendless random numbers. ’ (McKitrick, House of Lords evidence, op. cit.)
Using Mann’s algorithm, the two men fed a pile of random and meaningless data (‘red noise’) into the computer 10,000 times. More than 99 per cent of the time the graph which emerged bore a ‘hockey stick’ shape. They found that their replication of Mann’s method failed ‘all basic tests of statistical significance’.
When they ran the programme again properly, however, keeping the rest of Mann’s data but removing the bristlecone pine figures on which he had so heavily relied, they found that the Mediaeval Warming once again unmistakably emerged. Indeed their ‘major finding’, according to McKitrick, was that Mann’s own data confirmed that the warming in the fifteenth century exceeded anything in the twentieth century.44
One example of how this worked they later quoted was based on comparing two sets of data used by Mann for his second 1999 paper, confined to proxy data from North America. One was drawn from bristlecone pines in western North America, the other from a tree ring chronology in Arkansas. In their raw state, the Californian series showed a ‘hockey stick’ shape; the other, typical of most North American tree ring series, showed an irregular but basically flat line with no final upward spurt. When these were put together, however, the algorithm emphasised the twentieth-century rise by giving ‘390 times as much weight’ to the bristlecone pines as to the trees from Arkansas.45
In other words, although Mann had used hundreds of tree ring proxies from all over North America, most showing a flattish line like that from Arkansas, the PCAs used to determine their relative significance had given enormously greater weight to those Californian bristlecones with their anomalous ‘hockey stick’ pattern.
Furthermore, McIntyre and McKitrick found that Mann had been well aware that by removing the bristlecone pine data the ‘hockey stick’ shape of his graph would vanish, because he had tried it himself. One of the files they obtained from him showed the results of his own attempt to do this. The file was marked ‘Censored’ and its findings were nowhere mentioned in the published study.
What, however, concerned McIntyre and McKitrick as much as anything else about this extraordinary affair was what it revealed about the methods of the IPCC itself. Why had it not subjected Mann’s study to the kind of basic professional checks which they themselves had been able to carry out, with such devastating results?
Furthermore, having failed to exercise any proper quality control, why had those at the top of the IPCC then gone out of their way to give such extraordinary prominence to ‘the hockey stick data as the canonical representation of the earth’s climate history. Due to a combination of mathematical error and a dysfunctional review process, they ended up promoting the exact wrong conclusion. How did they make such a blunder?’
Continue reading The Real Global Warming Disaster by Christopher Booker (Continuum, 2009), available at BN.com, Amazon.com and Audible.com.

Conclusion: The global warming “hockey stick” is SCIENCE FRAUD

What all this reveals, of course, is that the global warming “hockey stick” is fake science. As Booker documents in his book, data were truncated (cut off) and software algorithms were altered to produce a hockey stick trend out of almost any data set, including random noise data. To call climate change “science” is to admit your own gullibility to science fraud.
The IPCC, it turns out, used science fraud to promote global warming and “climate change” narratives, hoping no one would notice that the entire software model was essentially HACKED from the very beginning, deliberately engineered to produce the alarming temperature trend the world’s bureaucrats wanted so they could terrorize the world into compliance with climate change narratives.
The Russians didn’t hack the 2016 election, in case you were wondering. But dishonest scientists really did hack the global warming modeling software to deceive the entire world and launch a whole new brand of climate change fascism that has now infected the minds of hundreds of millions of people across the planet. Everything they’ve been told about climate change, it turns, out, was all based on a software hack.

Read more: https://www.naturalnews.com/2017-09-19-climate-change-science-implodes-as-ipcc-climate-models-found-to-be-totally-wrong-temperatures-arent-rising-as-predicted-hoax-unraveling.html

FDA approving cancer drugs without proof that they cure patients or help them live longer

Cancer drugs can cost patients a staggering $171,000 a year, according to the Center for Health Policy and Outcomes at New York’s Memorial Sloan Kettering Cancer Center. But in many cases these cripplingly expensive drugs offer only marginal benefits – with no proof that they improve either survival rates or quality of life.
Now, health advocates – joined by many respected oncologists – are decrying the rush to approve drugs that break patients financially, while doing little or nothing to relieve their suffering. As you continue to read about this (below) – the reality surrounding these cancer drugs will become quite disturbing.

Scam ALERT: Price is unrelated to the performance of these cancer drugs

According to Kaiser Health News, a push by patient advocates for earlier access to cancer medications has led to the U.S. Food and Drug Administration (FDA) approving a new roster of oncology drugs. And few have fulfilled their hoped-for goal – that of allowing patients with limited life expectations to survive for years.
In fact, experts say that overall cancer survival rates have barely changed in the last decade – in spite of all the cancer treatments billed as “cutting-edge” and “state of the art.”
Not only are the vast majority of oncology drugs ineffective – but in many cases, the price of the medication has absolutely no relationship to how well the drug works. For instance, one of the most expensive cancer drugs on the market has one of the worst records when it comes to improving the lives of cancer patients.
Fran Visco, president of the National Breast Cancer Coalition, has blunt words regarding the FDA’s rush to approval. “We are very concerned about the push to get more drugs improved, instead of effective drugs approved,” Visco emphasizes.

Expert opinion: Most cancer drugs don’t work – despite their soaring costs

Dr. Vinay Prasad, assistant professor of medicine at the Oregon Health and Science University, has long been an outspoken critic of the effectiveness of cancer treatments.
Although cancer drugs do help some patients for a limited amount of time, most patients get little or no benefit from the newer drugs. (The last important cancer drug, Herceptin – acknowledged by many oncologists as a “game-changer” – received approval almost 20 years ago). In fact, Dr. Prasad notes that two thirds of the cancer drugs approved within the past two years present no evidence that they extend survival at all, causing some scientists and researchers to liken cancer treatment to a “lottery.”
And research bears out Dr. Prasad’s assertion. According to a study published in JAMA Otolaryngology – Head and Neck Surgery, 72 different new cancer therapies approved between 2002 and 2014 granted patients an average of a scant 2.1 more months of life – a decidedly disappointing statistic.

JAMA study of 18 approved cancer drugs offered shocking results

The most damning evidence of the ineffectiveness of cancer drugs was a study published in JAMA Internal Medicine, in which researcher Diana Zuckerman examined 18 different cancer drugs approved between 2008 and 2012.
After analyzing peer-reviewed findings and FDA review summaries – and calculating the drugs’ annual cost – Zuckerman found that none of the 18 offered a clear benefit, such as tumor shrinkage or progression-free survival. And only one medication – crizotinib, for non-small-cell lung cancer – had data demonstrating that it improved patients’ lives in any way (for example, by reducing pain or fatigue).
In addition, two drugs –peginterferon and cabozantinib – actually did more harm than good. Cabozantinib, the most expensive drug on the market for thyroid cancer, caused patients to score worse on a 5-point scale measuring diarrhea, fatigue, sleep disturbance, distress and memory problems.
And Prasad and Zuckerman are not the only experts to speak out, by far. Dr. Richard Schilsky, senior vice president and CMO at the American Society of Clinical Oncology, says that he questions the value of a therapy when the benefit is small, the toxicity similar to that of previous drugs, and the cost higher.

Cancer trials actually appear to be a pharmaceutical “sleight of hand” trick

Another disturbing aspect of cancer treatment is that people in cancer trials are disproportionately young, giving rise to misleading results. For example, 30 percent of cancer patients are older than 75. Yet, only 33 percent of participants in cancer trials are older than 65, and just 10 percent are over 75 – a clear disparity.
So, a drug that improves survival in liver cancer by three months affords no survival advantage among Medicare patients not involved in the clinical trial. In other words: patients who are older and sicker than those who participate in research studies “give the lie” to the rosy, unrealistic picture often painted by big pharma.
Yet another way to put it: when it comes to success rates of clinical cancer trials, it’s sometimes a case of: “Now you see it, now you don’t.”

Even modest expectations go unmet

The American Society of Clinical Oncology has set goals for newly-approved cancer drugs: extending life or controlling tumors for at least 2.5 months. But, in a study published in JAMA Oncology, four out of five cancer drugs failed to meet these modest standards.
The reason for the minimal standards? The rarity of truly effective cancer treatments.
(That said, there are some successes to point to. For example, the number of patients with advanced melanoma who survive five years after diagnosis has jumped from 5 percent to 40 percent since the development of immune therapies – which stimulate the patient’s natural defenses to fight cancer cells).
But breakthroughs and successes can still be agonizingly rare. “It’s not very often that we come across a transformative treatment,” acknowledges study leader Dr. Sham Mailankody, a myeloma specialist at Memorial Sloan Kettering.
For too many cancer patients today, the latest batch of mainstream cancer treatments involves minimal improvement, serious toxicities, maximal expense – and dashed hopes. These individuals deserve better.
Sources for this article include:
KHN.org
JAMANetwork.com
JAMANetwork.com

Read more: https://www.naturalhealth365.com/cancer-drugs-fda-2290.html

Tuesday, September 19, 2017

All 8 extreme childhood food allergies are also common ingredients in CDC-recommended vaccines… coincidence?

Food allergy awareness posters in elementary schools list the following 8 food products as the most popular food allergies among children. Allergic reactions from exposure, consumption or injection of these foods can be fatal. Those 8 ingredients include peanuts, nuts, wheat, soy, milk, eggs, fish and shellfish. If your M.D. tells you that your food allergies are hereditary, maybe that’s because your parents were injected with the same food “excipients” when they got their dozens of vaccines growing up. Either you inherited your parent’s allergies, or millions of humans are simply allergic to injecting proteins, foreign animal blood cells, aborted baby blood cells, known carcinogens, and heavy metal toxins directly into their muscle tissue and blood, which would make perfect sense for any normal person with a perfectly functioning immune system.

Exposing the link: Serum sickness and extreme food allergies

Could vaccine food ingredients be the “inexplicable” reason millions of American children can’t even be in the same room where someone else opens a package of nuts? Consider this: Peanut oils were first used as carriers in influenza vaccines in the mid-1960s, thought to enhance the vaccine’s strength. Before that, anaphylactic shock “syndrome” from exposure to nuts was virtually nonexistent. Nobody was fainting and suffering from respiratory distress and experiencing convulsions just because somebody ate a Snickers bar on the other side of the room.
Today, peanut allergy is the #1 cause of death from food reactions, and it’s primarily among children. Coincidence?  The reaction surge kicked into full force in the early 1990s. Is that because the mandated schedule of CDC-approved vaccines for children (before they turn age 7) doubled from the 1980s? It has more than doubled again since then! Take a look.
1980: 20 vaccines
1995: 40 vaccines
2011 – 2017: 68 vaccines (36 of those vaccines are administered before the age of 18 months)
That means nearly all of the vaccines given in the first 7 years of life in 1995 are now ALL given in the first 18 months of life. Maybe we should rename the top 8 food allergies “serum sickness.” Then the root cause would be realized and maybe doctors who actually understand nutrition (naturopaths) could step in and do something to reverse the “epidemic.”
As discovered over 100 years ago by Dr Charles Richet, anaphylactic reactions to certain foods are a result of intact proteins that bypass the digestive system and find their way into the blood. This is a universal trigger for allergic reactions in all animals. Interesting. The initial “sensitization” involves injection, which creates the hypersensitivity, and the later violent and sometimes deadly reaction comes from eating the same food. Dr. Richet worked primarily with eggs, milk and meat proteins.

Bacteria, viruses, pathogens and parasites thrive in egg and milk, and are carried like a time release capsule in peanut oil

Peanut adjuvants in vaccines in America is a huge secret. Vaccine manufacturers are NOT required anymore to disclose all of the ingredients in vaccines, and they are also NOT allowed to be sued by anyone, ever, for injuries from reactions to the injections. The full formula for any vaccine is never revealed on the vaccine insert information page, because the full formula contains “proprietary” information and is protected as intellectual property.
The FDA admits peanut protein traces persist in vaccines today. This is exactly why doctors are directed to inject vaccines intramuscular rather than intravenous, because there’s a better chance of absorption of intact proteins and less chance of a bad reaction. Still, no money has ever been allocated from the National Institute of Health (NIH) or the CDC to study the obvious connection between vaccine food protein excipients and food allergies. (The vaccine industry will never allow the unvaccinated population to serve as a control group for this testing, knowing the results that will be found.) It’s obvious that medical extremism is at an all-time high right now in America. You really have to look out for yourself and your family.

Important considerations regarding food allergies in relation to common vaccine ingredients

Initial warning signs and symptoms of allergic reactions to foods found in vaccines include mouth tingling, itching or metallic taste; also hives. Got wheat allergies? Is the allergy really to wheat or is it to yeast protein and yeast extract, that are both common ingredients in vaccines? Just check experimental jabs like the Cholera vaccine, Hep B, HPV, Meningococcal and Pneumococcal.
Got milk and dairy allergies? Check vaccines for casein derivatives called Miller or Mueller medium, and also lactose in the Hib vaccine. Plus, casamino acids are derived from cow’s milk, such as in DTaP vaccine. Many parents report children’s allergic reaction to the DTaP jab immediately after injection. Also beware because there is hydrolyzed casein in the meningococcus vaccine.
Got soy allergies? Did you know that Soy peptone broth is used in vaccines to enrich salmonella and cultivate microorganisms, including fungi?
Got fish allergies? Some oral vaccines contain fish oil. Allergic to shellfish? Read this informative blog at Cure Zone about the link to certain vaccines.
Got egg allergies? Eggs are in all flu vaccines and the yellow fever jab. Egg proteins are present in the final product also.
Also, children with the following allergies should have their parents check every single vaccine insert, including flu shots, for the following popular allergens that are found in many vaccines or the packaging, vial or syringe stopper: Latex, mercury, gelatin, antibiotics, formaldehyde, fetal cells from abortions, aluminum, MSG (monosodium glutamate), African Green Monkey kidney cells and polysorbate 80.
Vaccines are also now linked to learning disabilities, not just allergies! Look into natural immunity builders that have worked for millennia, including oil of oregano, chaga mushrooms, vitamin D3 and vitamin C. Maybe the secret to immunity and avoiding creating food allergies is to never inject food proteins, heavy metal toxins, gelatin, urea (animal urine) and other known carcinogens (like methyl mercury, aluminum and formaldehyde) into your muscle tissue. This is worthy of much careful consideration.
Learn more at Immunization.news.
Sources for this article include: 
Thedoctorwithin.com
Michigan.gov
CureZone.org
MPBio.com
FoodsMatter.com
Empowher.com
CDC.gov
Immunization.news
VaccineImpact.com
NaturalNews.com
ScienceForums.net

Read more: https://www.naturalnews.com/2017-09-18-all-8-extreme-childhood-food-allergies-are-also-common-ingredients-in-cdc-recommended-vaccines.html